What do you do when management asks for a percentage complete on an Agile project? The flippant answer is “tell them the percentage complete”. Agilists reject percentage complete when reporting on low level stuff. But for the project as a whole you can get quite an interesting metric, one that is based on real data, so why not calculate and share it.
Aggregating from Done
Percentage complete doesn’t work for User Stories or Tasks, but it does work for a project or programme. There are two criteria to allow this to be true:
- You can define the scope up front
- The work of each discipline is more or less evenly distributed
Total Scope
You need to know the total scope and have estimates to be able to report percentage complete. If you don’t have a total size you can’t report the percentage. Projects and programmes usually do have an idea of the scope at the start whereas this isn’t essential for pure product development teams. Admittedly scope for an Agile programme or project is fairly high level. None-the-less as User Stories are delivered to live, i.e. are properly “Done”, you get credit for a proportion of the total scope. A percentage.
Being Agile, of course, scope can change. But if you apply requirements trade-off rather than allow scope creep the total size of the work won’t change and the percentage figure still works.
Pure product development is about discovery and so there is little idea of overall scope at the start. That means you can’t report a percentage complete.
Similarly in a situation where initial scope is known but there is massive scope creep then the percentage complete isn’t going to be very informative.
Work is evenly distributed
The other caveat is that percentage complete only works if the work of each discipline (BA, UX, dev, test) is more or less evenly distributed throughout the project or programme. Percentage complete won’t work if the work is lumpy for any reason, for example, all UX is done up front or all testing is done at the end. The problem is with the definition of “Done” on a User Story. If testing is at the end then all User Stories become “Done” more or less at the same time, i.e. at the end. That doesn’t help with reporting steady progress.
Progress Charts
Reporting percentage complete shouldn’t outrage Agilists (although it might) because common Agile artefacts already show it. The Product Burn up Chart of Scrum and the Cumulative Flow Diagram (CFD) of Kanban both, in a fashion, show the percentage complete.
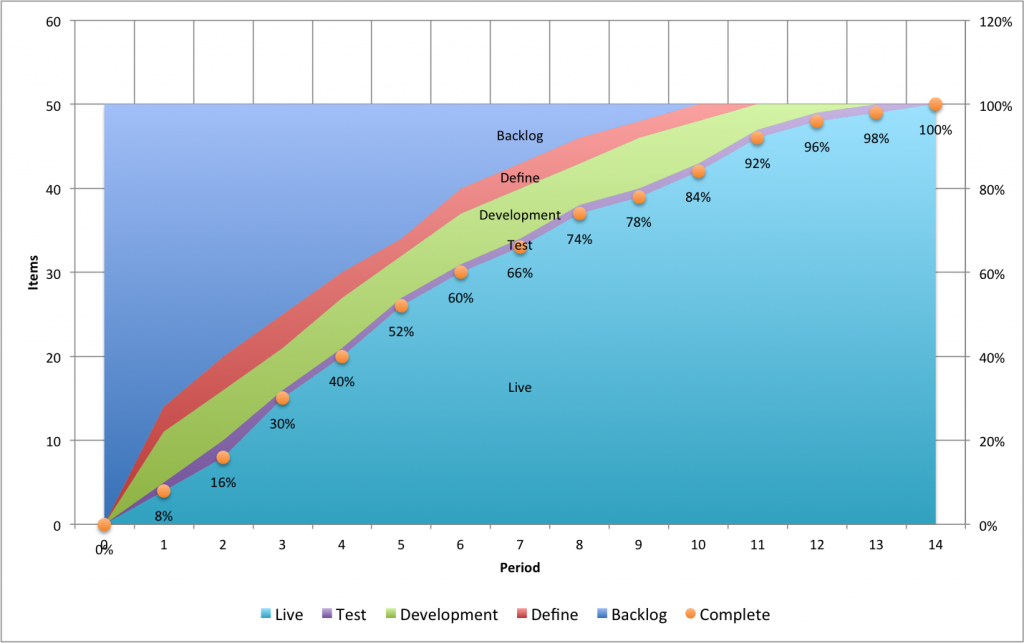
CFD Showing Percentage Complete
You can see the percentage complete in the example CFD. It sits on the top of the Live curve because that is the point when work items are properly Done. Over time the percentage complete gradually rises to 100%.
This post is part of my What do I do When … ? series. Please drop me a line or add a comment if you’ve got a question you’d like answered.