No battle plan survives contact with the enemy
Field Marshal Helmuth Graf von Moltke
Life is what happens to you
while you’re busy making other plans
John Lennon
Agile Project Planning tells us what we expect to do, but, to paraphrase the quotes above, plans often turn to custard. The job of the Agile Project Manager is to guide the team to successful delivery despite the challenges the world throws at the project. This article is about monitoring the project against the plan and intervening when we notice things going off track. In particular it covers Traditional Project Monitoring & Control, Agile versus Traditional Monitoring & Control, Agile Project control, Agile project metrics, Agile Project Reporting, and Agile Project Monitoring.
Traditional Project Monitoring & Control
Controlling and Monitoriing is one of the five project management process groups in the Project Management Body of Knowledge (PMBOK) from the Project Management Institute (2004).
Traditional project management is very concerned about observing and measuring actual project performance against the plan and fixing it if it varies. Variance from the plan is considered bad unless it is approved by Change Management. Project monitoring is observation part of this and project control is the corrective action taken as a result. Typically the project manager tracks factors such as cost, quality and effort. Bear in mind a traditional plan has the fine grain tasks from the Work Breakdown Structure on the schedule (see Project Planning) and tracking effort on each such task is quite time consuming.
Agile versus Traditional Project Monitoring & Control
My belief is that Agile provides more opportunities to monitor what is going on than traditional methods and hence offers more effective opportunities to intervene (i.e. control). Traditional project monitoring focuses on tracking how much effort is expended on each task. I think this is a waste of time (unless you’re billing a customer on this basis). The main Agile monitoring technique is to track what software has been incrementally delivered. This is both easier and has much more impact with the customer. The Product Demonstration at the end of a Timebox (part of the Timebox Review Meeting) is where the product increment is show cased.
Agile also offers several other ways to monitor progress. Tracking Velocity is the closet to the traditional tracking of effort. But Velocity is a single number for the entire team for the entire Timebox so tracking this is much simpler than tracking a multitude of discrete tasks.
Subsequent sections look at Agile project monitoring, Agile project metrics, Agile project reporting, and Agile project control.
Agile Project Monitoring
Agile monitoring comes in a variety of forms:
- Frequent delivery
- Colocation
- Daily Team Meeting
- Timebox Review Meeting
Frequent Delivery
Frequent delivery is key to Agile. So much so that three of the Principles Behind the Agile Manifesto relate to frequent delivery of software:
Working software is the primary measure of progress.
Our highest priority is to satisfy the customer
through early and continuous delivery
of valuable software.
Deliver working software frequently,
from a couple of weeks to a couple of months,
with a preference to the shorter timescale.
The best evidence that a software project is on track is working software, preferably deployed to production. There is working software at the end of each Timebox – this is what is reviewed in the Timebox Review Meeting. And there is working software on production every Release; at least once at the end and usually more often.
Frequent delivery allows the Product Owner to declare a product “done” at any time or the Business Sponsor to declare the project finished at any time. Finishing could be for any number of reasons:
- the competition just shipped
- the company needs the cash
- the user/customer needs the functions
- that was when it was promised
Colocation
Two of the Principles Behind the Agile Manifesto are:
The most efficient and effective method of
conveying information to and within a development
team is face-to-face conversation.
Business people and developers must work
together daily throughout the project.
Agile teams try to promote face-to-face communication and to reduce the channels of communication in general . A key way to do this is to be colocated in the same  area. Two people sitting next to each other are more likely to discuss an issue than the same two people sitting 20 metres apart in separate offices. The further the distance and the greater number of physical barriers then less likely the discussion will happen at all. Sitting together also makes it easy for several people to cluster around the same screen, if that is needed, and for a group to convene in front of the project board.
As a project manager I found colocation incredibly useful. Being with my team meant I could over hear ad hoc conversations, thus staying in touch with the issues facing the team, and intervene if necessary.
Daily Team Meeting
The Daily Team Meeting is focussed, short, and daily. The Project Manager facilitates the meeting. The idea is to check the team’s progress towards the Timebox goal and highlight any impediments. The meeting is held daily, at a regular timeslot, and lasts at most 15 minutes; the meeting is a key part of the Agile Lifecycle / Agile Heartbeat. I’m quite keen on the XP style “stand-up” meeting in front of the board with the Timebox Plan; standing up helps to keep the meeting short and the board acts an memory aide and highlights what the team needs to get done.
The format of the meeting is predictable, with each team member answering three questions:
- What have you achieved since the last Daily Team Meeting?
- What will you achieve between now and the next Daily Team Meeting?
- What is getting in your way?
The meeting is not about problem solving or discussion. Longer conversations need to be taken off-line. The Project Manager logs the impediments. Some of these can be solved immediately but other need to be fed into Agile Risk Management.
Timebox Review Meeting
The Timebox Review Meeting we check both our progress on the product and our process. As a result the Timebox Review Meeting has two parts:
- Product Demonstration
- Retrospective
The Agile Team, and specifically the Product Owner, attend the Timebox Review meeting. Other stakeholders are welcome to the Demonstration bit but are normally excluded from the Retrospective.
Product Demonstration
The Product Demonstration allows the Agile Team to celebrate delivering some software, the Product Owner to more or less formally accept this software, and for everybody to discuss what next. The Agile Team is meant to deliver working software every Timebox and the review is to look at the most recent product increment. Different teams have a different approaches to the demonstration. I’ve always had each developer demonstrate the enhancements and/or changes they’ve contributed. On the other hand I know other people, particularly in the Scrum world, advocate the Product Owner demonstrate all of the new/changed features – this is symbolic of their acceptance of the software. Whoever does the demonstration it will spark conversations about further work to be done which will get recorded as User Stories in the Release Plan and/or be reflected in Tasks in subsequent Timebox Plans (see Agile Project Planning and Agile Change Management). This is a key part of Agile as the Product Owner has repeated (and early) chances to provide feedback to the team and has a chance to adjust the product vision based on how the product is evolving.
Retrospective
One of the Principles Behind the Agile Manifesto is:
At regular intervals, the team reflects on how
to become more effective, then tunes and adjusts
its behavior accordingly.
Retrospectives are appropriate at the end of each Timebox in the Timebox Review Meeting, at the end of each Release, and at the end of the Project (part of Agile Project Closure). A Retrospective is an opportunity to reflect on their performance and look at ways to improve. Retrospectives cover:
- Set the stage: Introductions and Agenda
- Review: Review action points from previous Retrospectives
- Gather data: Timeline – What significant events happened when?
- Generate insights: Things that went well, went badly, things we learned, novel ideas, and things to thank people for (“bouquets”)
- Action plan: Actions to do to improve the process in future – Which ones to actually do – Who will do them – When
- Close: Summarise actions, thanks, bye
The team has to decide which of the action points to implement. Few teams have the capacity to implement all suggestions immediately, so they will only address a subset each time, possibly only the most pressing issue. I treat these process improvement action points exactly like User Stories, i.e. they get estimated and go on the Release Plan. I do this because, in the short term, work on process improvement reduces the amount of work that can be done on new development.
Agile Project Metrics
Key measures are:
- Velocity
- Hit Rate
- Work Remaining on Tasks
- Project Cost
Velocity
Velocity is a measure of the teams capacity to delivery in a Timebox. The unit of measure is the same as that used for estimating (see Agile Project Planning):
- For User Stories this is Story Points.
- For Tasks this is actual hours.
Velocity is the key to the empirical aspect of Agile Project Management. The predicted Velocity for the first Release Plan, created during Agile Project Initiation, is guessed or based on data from previous projects. After that the actual Velocity is measured at the end of each Timebox. To do this total the estimates for the User Stories completed in the Timebox; this gives the actual Velocity for that Timebox. By the way, “completed” means “fully, totally, not even a little bit left undone, absolutely completed”. None of this 95% complete business. This actual measure of Velocity is used to predict the Velocity for subsequent Timeboxes in the Release Plan. Agile processes promote a sustainable pace, so the Product Owner can’t cram more into a Timebox than the Velocity allows.
Task level Velocity works in a similar way during the Timebox Planning Meeting. It is used to validate the amount of work the Agile Team takes on for the Timebox.
It will become apparent after only a couple of Timeboxes if the Agile Team has sufficient capacity to deliver the essential functionality by the deadline. If it looks like the team won’t be able to deliver then corrective action can be taken, which usually means cutting scope.
Hit Rate
The Hit Rate is the percentage of work allocated to a Timebox that was actually completed. Ideally a team should have a hit rate near 100%. A low Hit Rate indicates the team is struggling to meet their commitments; this might be caused by over commitment, impediments, etc. For example, if a team aimed for 100 Story Points of User Stories, but ended up only completing 55 Story Points, their hit rate is 55%. This might be ok for one Timebox, but if the pattern repeats time and again, the team is over committing and should adjust their workload down. I find such teams are ignoring their actual Velocity in favour of a hoped for Velocity.
Work Remaining on a Task
Each day the team estimates the work remaining on each active Task. The estimate of work remaining Task will hopefully go down over time, but it may rise if the Task is more complicated than anticipates.
This is where the data for the Timebox Burn Down Chart come from.
Project Cost
In most organisations the cost of a project must be tracked to ensure it does not go over budget. Since you’re tracking on it you may as well report it.
Agile Project Reporting
Informative Workspace
An Informative Workspace contains Information Radiators, otherwise known as Big Visible Charts. These terms indicate the purpose – to radiate information via big visible charts to create an informative workspace. The team just has to glance at them to know how they’re doing. Similarly (informed) visitors only need to walk into the team area and look round for about 15 seconds to know what is going on. Obviously these charts are indicative and a longer investigation would be needed to delve into any issues.
Candidates for the Informative Workspace are:
- Timebox Goal
- Timebox Plan: showing the User Stories and the associated Tasks; normally both are on index cards
- Release Plan
- Timebox Burn Down Chart
- Release (or Product) Burn Down Chart
I favour a couple of pin boards for my Informative Workspace but teams have considerable flexibility in the actual format. Some use white boards, some blue tac charts to the wall and some even use a projector. Despite the fact I’m keen on using spreadsheets and a task tracking database, I’m not keen on projectors … they detract from the low tech, tactile appeal of the index cards.
Timebox Plan
The Timebox Plan on the project board shows the status of each Task. There are several ways of doing this but a trick I learnt from Rachel Davies is to use coloured stickers to indicate the status of each Task. Typical status values are Not Started (Red), In Progress (Yellow), and Done (Green). With the status of each Task clearly visible a glance at the Timebox Plan gives a good idea of the overall Timebox status. The team only gets credit for the Done Tasks.
Release Plan
New Velocity measurements are fed into the Release Plan. This will have an impact on what is expected to be complete when. If the Velocity drops some items will become out-of-scope. If the Velocity goes up then some new items can go in-scope. (See Agile Change Management).
Timebox Burn Down Chart
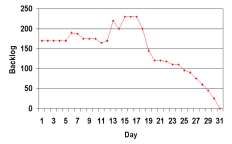 A Timebox Burn Down Chart is a method of visualising whether the team is on track to complete the work allocated to the Timebox. If the downward trench indicates not all of the work will be completed in time we have an opportunity to intervene and do something about it.
The example chart is a Sprint Backlog Chart from Scrum. The X-axis is the day of the Sprint (timebox) and the Y-axis is the remaining work in hours. (Note: the Sprint Backlog is what Scrum calls the Timebox Plan).
Burn up or Burn down
Some teams like to use a Burn Up chart rather than a Burn Down Chart. Where a Burn Down Chart tracks Work Remaining a Burn up Chart tracks Total Work Done.
Release Burn Down Chart
A Release Burn Down Chart does the same thing but for an entire Release. It shows if the team is on track to complete the User Stories required for the Release.
Status Report
You might want to do an old fashioned status report. In fact some customers demand a Status Report – it is one of those (misleading) indicators that the Project Manager is in control. For other customers, those who aren’t colocated, you might want to package up the project information to send to them. If nothing else writing a status report is a useful weekly discipline as it forces you to look at the project with a semi critical eye. The format is up to you.
Agile Project Control
War is a matter of expedients
Field Marshal Helmuth Graf von Moltke
Agile project throw up a lot of data for the Agile Project Manager to use in controlling, or steering, the project. I’ve outlined a few possible interventions.
Manage New Risk
Often the team will highlight a new risk that needs management in Agile Risk Management.
Decrease Scope
At the end of each Timebox you should review the release plan to whether the Agile Project Scope has to change based on the actual Velocity. Often the team finds that the actual Velocity is lower than hoped. In this case Agile Project Scope must decrease by moving User Stories out-of-scope in Agile Change Management.
Increase Scope
If you’re lucky your actual Velocity is higher than anticipated and your team is churning out more functionality that you thought possible. In this case you can increase the Agile Project Scope can increase by adding User Stories in Agile Change Management.
Replan the Timebox
If the team are having trouble meeting their commitments in the Timebox you should replan the remainder of the Timebox using Agile Project Planning. The idea is to get maximum value from the remaining time. There is an overhead in doing a replan but this is worth it if your team can’t do everything and so has to make trade offs.
Terminate the Timebox Abnormally
If the Timebox goes off the rails the Product Owner should terminate it abnormally. Anybody can suggest abnormal termination but only the Product Owner can make it happen. There must be a clear business reason for this but examples are easy to find:
- the work allocated to the Timebox is building the wrong product
- the work allocated to the Timebox is not delivering business value
- natural disaster
Terminating the project means stopping it. Now. Immediately. You then go into Agile Project Planning to start a new Timebox.
Terminate the Project Abnormally
Similarly if the entire project is going off the rails the Product Owner can terminate it abnormally. Of course terminating a project is more serious than stopping one Timebox, but the reasons are similar:
- the project is building the wrong product or the product will be obsolete
- the project is not delivering business value
- natural disaster
- parent company gone bankrupt
The team then runs a series of “tidy up” Timeboxes before going into Agile Project Closure.
Increase Staff / Increase Velocity
If it becomes clear that the team can’t deliver all of the hoped for scope in the time available it is tempting to add people to increase Velocity. This is contrary to the assumptions of Agile – Agile puts Cost ahead of Scope – and is contrary to an axiom of computer Science that adding people to a failing project doesn’t help.
On the other hand if it is early enough in the project then adding people might help. But don’t expect an immediate uplift in Velocity when the new staff arrive. New staff have a learning curve and the old hands have to help them through it, so, in the short term, you may well see Velocity decrease.
The important thing is to keep measuring Velocity each Timebox and adjust your Release Plan accordingly. You’ll see it when the new staff start having a positive impact.
Extend the Project / Add Timeboxes
If the team can’t deliver the aspired Agile Project Scope another strategy is to extend the project by adding Timeboxes at the end. As with adding people I can’t recommend this strategy. It is contrary to an assumption of Agile – putting Time ahead of Scope – but more pragmatically the high priority User Stories are scheduled early and so the last Timeboxes might not add much value. But the customer may be relieved by having the apparent option to get everything they originally wanted.
Monitoring against the Critical Chain
Wikipedia: Critical Chain Project Management
Critical chain project management does it differently again. I haven’t tried this but I’m tempted to do so in parallel to the Agile practices described above.
Project performance in Critical chain project management is measured by how much of the various buffers has been consumed – buffers are described in Agile Project Planning. Bear in mind the buffers represent safety. Healthy, untouched, buffers indicated a healthy project. Almost depleted buffers indicate approaching disaster.
References
Agile Manifesto: Principles Behind the Agile Manifesto
Beck, K. (2000). Extreme Programming Explained: Embrace Change. Reading, Massachusetts: Addison-Wesley.
Beck, K, & Fowler, M. (2001). Planning Extreme Programming. Boston: Addison-Wesley.
Cohn, M. (2006). Agile Estimating and Planning. Prentice Hall.
Project Management Institute. (2004). A Guide to the Project Management Body of Knowledge (PMBOK Guide) [3rd Edition]. Author.
first of all you have here a very good article. I’m doing a researsh over Control in agile projects, if you have any helpful links that would help I will appreciate it
Traditional project management also tracks task status. Can completed tasks not be akin to tracking incremental software delivery?
From your example I get the impression that agile is focused on relatively similar feature deliveries that are easy to track and compare. In this case velocity (stories per timebox) makes sense.
Tasks include varying kinds of deliverables that are hard to compare directly without using the effort per task as the baseline. In this case a comparison of planned vs. actual effort to accomplish tasks gives insight.
To simplify this comparison planned vs. actual effort can be compared per job, per project, or per person in order to assess performance relative to a common baseline. This can also give insight relatively quickly whether a project is able to meet its targets on time or needs corrective actions.
Your description of the traditional vs. agile triangle in another post is very helpful to understand the difference between agile and traditional project management approaches and the types of corrective actions that are necessary in both.